Research Article
Stepwise regression modeling on the monitoring of separation of Salvianolate through macroporous resin chromatographic column using UV spectral data

Yongsuo Liu1*, Yong Wang2 and Guoan Luo2
1Aviation Medicine Research Institute, Civil Aviation Medicine Center, Beijing 100123, China
2Analysis Center, Tsinghua University, Beijing 100084, China
*Address for Correspondence: Yongsuo Liu, Aviation Medicine Research Institute, Civil Aviation Medicine Center, Beijing 100123, China, Email: [email protected]
Dates: Submitted: 27 December 2018; Approved: 16 January 2019; Published: 17 January 2019
How to cite this article: Liu Y, Wang Y, Luo G. Stepwise regression modeling on the monitoring of separation of Salvianolate through macroporous resin chromatographic column using UV spectral data. Arch Pharm Pharma Sci. 2019; 3: 001-010. DOI: 10.29328/journal.apps.1001012
Copyright License: © 2019 Liu Y, et al. This is an open access article distributed under the Creative Commons Attribution License, which permits unrestricted use, distribution, and reproduction in any medium, provided the original work is properly cited.
Keywords: Stepwise regression model; UV spectrum; Variable selection; Optimization
Abstract
Aim: Study the monitoring method of separation of Salvianolate through macroporous resin chromatographic column using UV spectral data.
Method: HPLC was used to determine the concentration of Salviol B in the eluent liquid of macroporous resin chromatographic column. The UV spectrum of the eluent liquid was measured using portable UV spectrometer. Stepwise regression was used to develop the model to predict the concentration of Salviol B in the eluent liquid of macroporous resin chromatographic column using the UV spectral data.
Result: Stepwise regression model was developed to predict the concentration of Salviol B in the eluent liquid of macroporous resin chromatographic column. RMSE was 0.3263, MAP was 0.2323 and CV was 0.1796.
Conclusion: Stepwise regression model could be used to predict the concentration of Salviol B in the eluent liquid of macroporous resin chromatographic column using UV spectral data
Injection Powder of Salvianolate is used to cure coronary heart diseases and angina pectoris. Its main effective composition is Salviol B. When the content of Salviol B is between 80 and 90 per cent the curative effect of Injection Powder of Salvianolate is good [1,2]. During the production of Injection Powder of Salvianolate, crude product of Salvianolate must be extracted from Salvia miltiorrhiza Bge and subsequently purified through macroporous resin chromatographic column. The purpose of this study is to establish the method to monitoring the purifying process of crude product of Salvianolate through macroporous resin chromatographic column.
Spectral technology could be used to monitor the separation process online for its rapid determination speed [3,4]. In this study the UV spectrum of the eluent liquid was used to predict the concentration of Salviol B. The results showed that the UV spectrum could be used to predict the concentration of Salviol B in the eluent liquid.
Principle
Stepwise regression is one of the most popular methods to establish the prediction model [5-9], especially for selecting the independent variables which are linearly correlated to the dependent variables.
During the purifying process of crude product of Salvianolate through macroporous resin chromatographic column, the concentration of Salviol B cannot be determined directly in the eluent liquid using UV spectral data. The eluent liquid is the mixture of Salvianolate and other components. In this study HPLC was used to determine the concentration of Salviol B in the eluent liquid. Stepwise regression was used to establish the model to predict the concentration of Salviol B in the eluent liquid of macroporous resin chromatographic column using its spectral data.
The spectral data of the samples of the eluent liquid of the macroporous resin chromatographic column is x.
The concentration of Salviol B in the samples of the eluent liquid isy.
Using spectral data to predict the concentration of Salviol B should determine the constant and the coefficients of equation (1).
(1)
:The constant of the stepwise regression model.
:The coefficients of the stepwise regression model at wavelength i.
The absorbance of the eluent liquid at the wavelength i.
Experiments
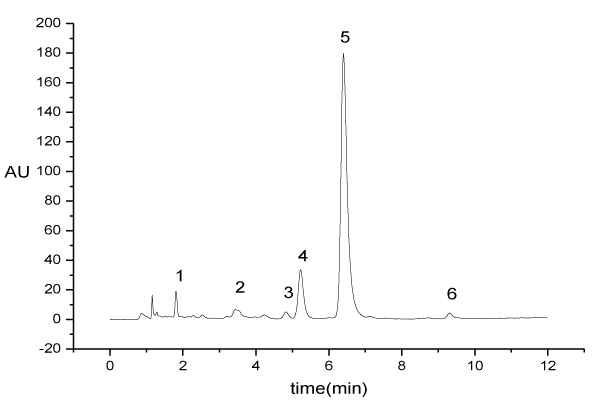
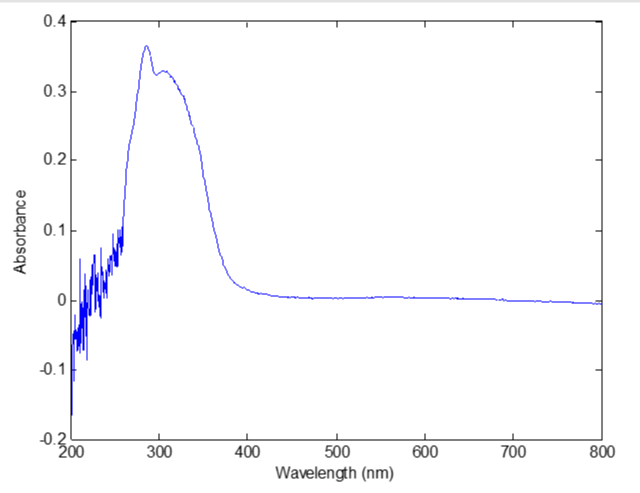
High performance liquid chromatography (Waters 2695) was used to determine the concentration of Salviol B in the eluent liquid of macroporous resin chromatographic column. The UV spectrum was scanned from 200nm to 800nm by the portable spectrometer (Pors-15, Beijing Persee Co Ltd). Each eluent liquid sample had 1024 spectral data. Figure 1 is the HPLC chromatographic gram of the eluent liquid. Figure 2 is the UV spectrum of the eluent liquid.
Three batches of samples were collected from the production line. The time interval was 5 minutes between two samples collected from the eluent liquid of the macroporous resin chromatographic column. In addition all the samples were diluted according to the ratio 1:200 with water before scanned with the portable spectrometer.
Establishing of the stepwise regression model
The prediction error of the stepwise regression model: The concentrations of Salviol B dertermined by HPLC and UV spectral data of two batches eluent liquid samples were used to establish the prediction model and one batch was used to test its prediction ability. There are three methods for varible selection: forward, backward and stepwise [10-12]. The stepwise varible seletion method was used to estabalish the model in this study. The constant and the coefficients of the stepwise regression model were calculated by a program designed with matlab.
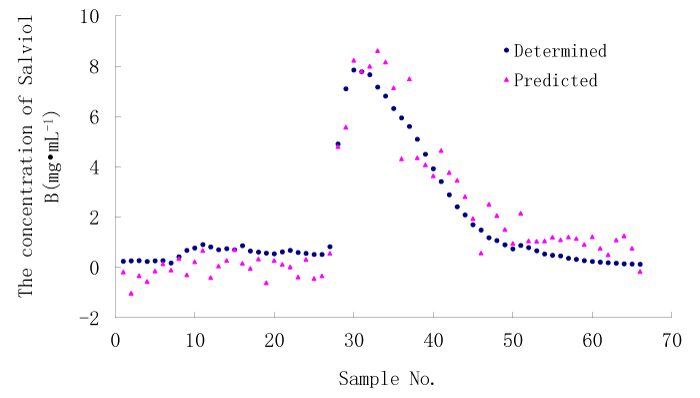
After stepwise regression 42 variables were selected into the model. The root mean squared error (RMSE) between the determined and the calculated values of concentration of Salviol B was 0.8111, the mean absolute error (MAE) was 0.6935 and the coefficient of variation (CV) was 0.4465. Figure 3 demonstrates the predicted concentration of Salviol B by the stepwise regression model using UV spectral data and the determined concentrations of Salviol B by HPLC.
Figure 3: The predicted concentration of Salviol B by stepwise regression model using UV spectral data and the determined concentration of Salviol B using HPLC.
RMSE was calculated according to Formula (2). MAE was calculated according to Formula (3). And CV was calculated according to Formula (4) [13-15].
(2)
(3)
(4)
: the calculated concentration of the Salviol B in the ith sample.
: the number of samples.
: the mean value of the concentrations of Salviol B in all samples.
The results showed that the prediction error was so big that the UV spectral data cannot be used to monitor the purifying process of crude product of Salvianolate through macroporous resin chromatographic column. For the error was too large for us to decide when to start collecting and when to cease collecting the eluent liquid.
The fitting error: The prediction error was so big that the fitting error was calculated to examine if there was something wrong with the spectral data. That was the error between the concentration of Salviol B determined with HPLC and the calculated value with the spectral data and the constant and the coefficients of the stepwise regression model.
The RMSE of the two batches of samples used to develop the stepwise regression modle was 0.0559, MAE was 0.0395, CV was 0.0191, and R2 was 0.9996. The fitting error of the two samples was very small. So the spectral data of the samples should be used to predict the concentrations of Salviol B. However the prediction error was much larger than that of the fitting error. The reason may be the noises of the spectral data.
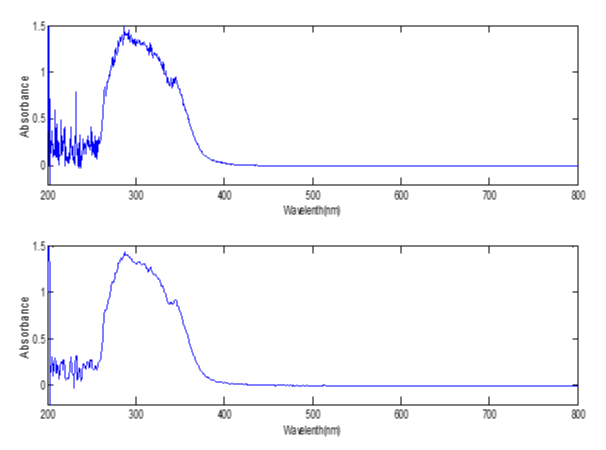
Pretreament of the spectral data: As shown in figure 2, the noises of the UV spectrum were so obvious that we must smooth it before modeling. The UV spectral data were smoothed with matlab program using Savitzky-Golay method. And the smoothing span was 7. Figure 4 demonstrated the UV spect.
Figure 4: The UV spectrum of the eluent liquid before smoothing (above) and after smoothing (below).
After smoothing of the UV spectral data, there were 29 variables selected into the stepwise regression model and R2 was 0.9975. The RMSE of the testing samples was 0.4860, MAE was 0.3515, CV was 0.2675. After smoothing the predition error decreased greatly.
The correlation between the spectral data and the concentrations of Salviol B: According to Lamb-Beer theory, the UV absorbance of the chemicals is correlated to their concentrations. And stepwise regression is linear regression. The correlation of the UV spectral data between the concentrations of Salviol B is very important. The correlation coefficent aimed to assess the correlation of the UV spectral data and the concentrations of Salviol B. The correlation coefficent was calculated according Formula (5).
(5)
:The correlation coefficient of the spectral data and the concentrations of Salviol B at the wavelength i.
:The spectral data at wavelength i.
:The mean value of the spectra data at wavelength i.
:The concentration of Salviol B in the jth sample.
:The mean value of the concentrations of Salviol B.
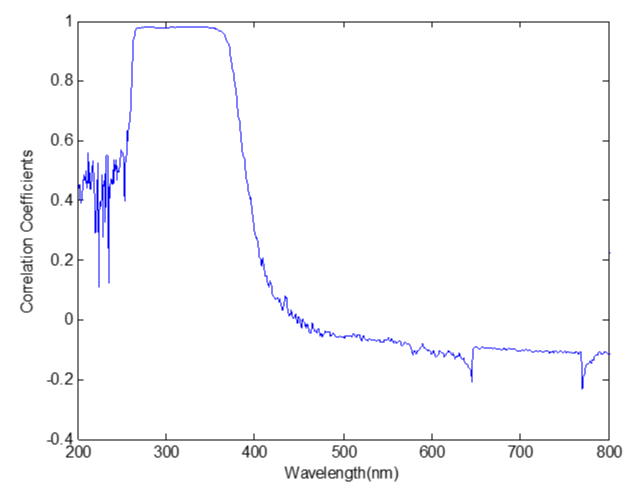
Figure 5 showed that the correlation between the UV spectrum and the concentrations of Salviol B is good from about 260nm to 380nm. So the spectral data from 260nm to 380nm were selected to establish the stepwise regression model.
Figure 5: The correlation coeffcients between the UV spectrum data and the concentrations of Salviol B.
There were 11 varibles selected into the stepwise regression model and R2 was 0.9839. The RMSE of the testing samples was 0.5807, MAE was 0.3854 and CV was 0.3197.
The results showed that the prediction error increased when selecting variables between 260nm and 380nm.
Optimization of the variable selection process
How to select the variables is very important to establishing the prediction model. Usually the variable would be added to the stepwise regression model if p<0.05 and removed out of the stepwise regression model if p>0.1.
In this study we found that according to this standard the stepwise regression model did not produce the minimum prediction error.
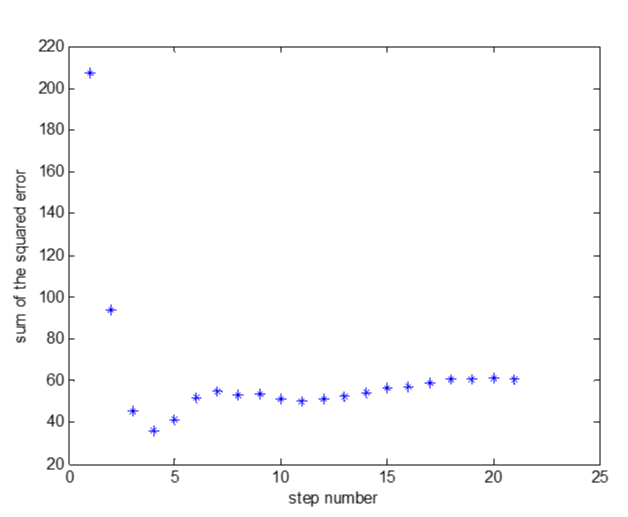
So we proposed a new standard to the selection of the variables. We used the sum of the squared error (SSE) to optimize the variable selection process. It can be calculated according to Formulae (6). That is on the basis of p value we used the prediction error to optimize the stepwise regression model. Figure 6 showed that the variable selection process did not cease at the minimum of prediction error.
(6)
Summarry
The prediction abilitiy of the stepwise regression model was affected by the noises of the spectral data, the correlation between the spetral data and the concentrations of Salviol B and the variable selection processs of the stepwise regression program. Table 1 showed the prediction error of the stepwise regression modle affected by these factors.
In table 1 from the second to the fourth columns were the prediction error when selecting variable between 200nm and 800nm, from the fifth to the ninth columns were the prediction error when selecting variables between 260nm and 380nm.
When variables were selected between 200nm and 800nm, the predition error was bigger than that selected between 260nm and 380nm for the better correlation and lower noises of the latter as shown in the sencond and the fifth column before smoothing. When variables were selected between 200nm and 800nm, the prediction ability of the stepwise regression model would improve obviously after smoothing as shown in the second and the third column. When variables were selected between 260nm and 380nm, the prediction ability of the stepwise regression model decreased after smoothing as shown in the fifth and the sixth column. The reason may be that the noises were not so obvious and some important information had been lost during smoothing between 260nm and 380nm. So the predicton error was smaller when selecting variables between 260nm and 380nm before smoothing than between 200nm and 800 after smoothing both optimized with SSE as shown in the fourth and eighth column.
So the smoothing span was adjusted. When the span was set at 5, the prediction error reached the minimum value as shown in the last column when selecting variable between 260nm and 380nm.
Result
We used two batches to establish the stepwise regression model and a third batch to test its prediction ability.
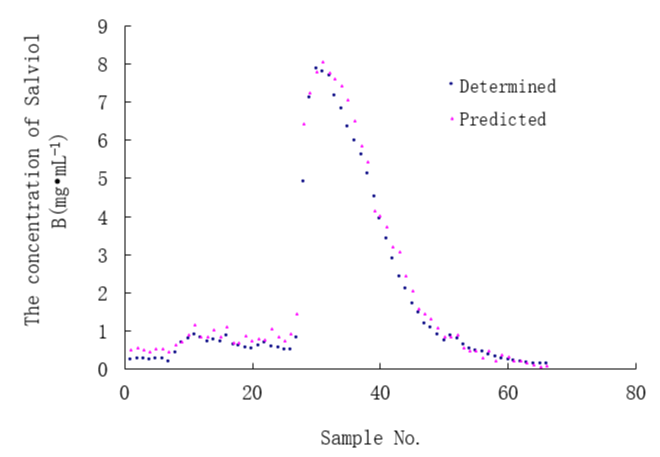
4 variables were selected into the stepwise regression model and the stepwsie regression formula was (7).
(7)
The REMS of the concentration of Salviol B was 0.3263, the MAE was 0.2323 and the CV was 0.1796. The predicted value of Salviol B using UV spectral data and the determined concentration by HPLC were shown in figure 7.
Figure 7: The predicted concentration of Salviol B by stepwise regression model using UV spectral data and the determined concentration of Salviol B using HPLC.
Discussion
The importance of correlation
Whether the spectral data could be used to establish the prediction model with stepwise regression or not depends on the correlation between the spectral data and the concentrations of Salviol B. The correlation coefficients between the spectral data and the concentrations of Salviol B were calculated according Formula (5). Figure 4 showed that the UV spectral data had better correlation to the concentration of Salviol B from 260nm to 380nm. If variables were selected from 200nm to 800nm, there were 5 variables selected into the model. We would get smaller fitting error but the prediction error would increase. The RMSE of the concentration of Salviol B was 0.4427 and the CV was 0.2437, MAE was 0.3052 as shown in table 1. So the spectral data from 260nm to 380nm had been used for variable selecting to establish the stepwise regression model.
| Table 1: The prediction error while optimizing the stepwise regression model. | ||||||||
| 200-800nm | 260-380nm | |||||||
| BS | AS7 | OSSEAS7 | BS | AS7 | OSSEAS7 | OSSEBS | OSSEAS5 | |
| RMSE | 0.8111 | 0.4860 | 0.4427 | 0.4945 | 0.5807 | 0.4119 | 0.3545 | 0.3263 |
| MAE | 0.6935 | 0.3515 | 0.3052 | 0.3977 | 0.3854 | 0.3081 | 0.2873 | 0.2323 |
| CV | 0.4469 | 0.2675 | 0.2437 | 0.2722 | 0.3197 | 0.2267 | 0.1951 | 0.1796 |
| R2 | 0.9996 | 0.9975 | 0.9693 | 0.9930 | 0.9839 | 0.9629 | 0.9593 | 0.9623 |
| NVBS | 42 | 29 | 5 | 19 | 11 | 4 | 3 | 4 |
| BS: Before Smoothing. AS7: After Smoothing with span=7. OSSEBS: Optimization with SSE before smoothing. OSSEAS7: Optimization with SSE after smoothing with span=7. OSSEAS5: Optimization with SSE after smoothing with span=5. NVBS: Number of variables selected. |
||||||||
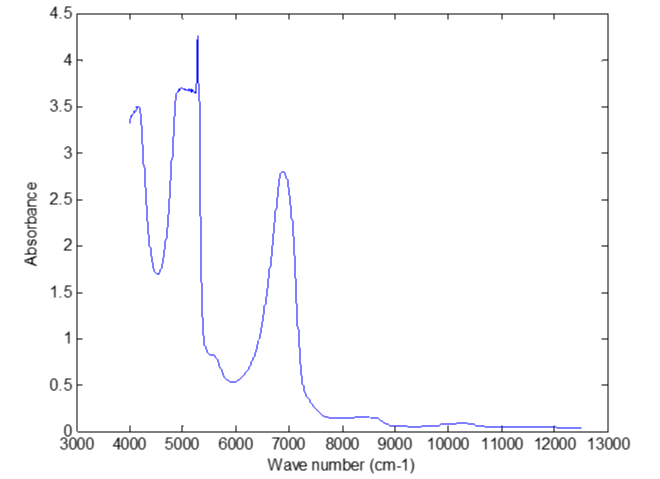
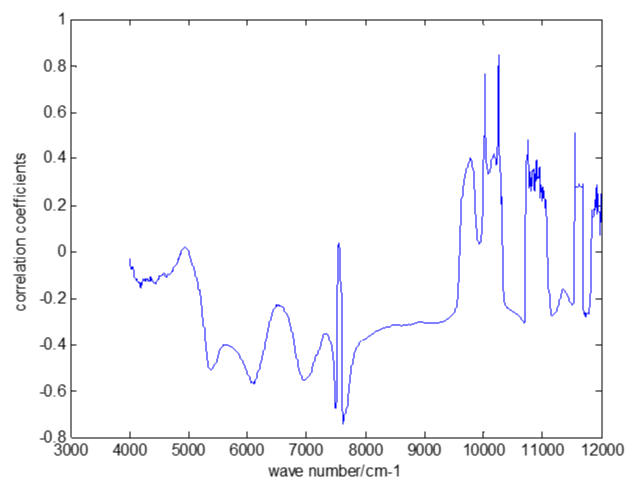
NIR spectral data had been scanned too. The NIR spectral data of the eluent liquid were shown in figure 8. The correlation coefficients between the NIR spectral data and the concentrations of Salviol B were shown in figure 9.
Figure 9: The correlation coefficients between the NIR spectral data and the concentrations of Salviol B.
The NIR spectral data of the eluent samples were badly correlated to the concentrations of Salviol B. The prediction error of stepwise regression model using NIR spectral data was very large.
Data smoothing
The noise of the spectral data had great influence on the stepwise regression model. Before smoothing the prediction error was very large, RMSE=0.8111, MAE=0.6935, CV=0.4469, after smoothing RMSE=0.4860, MAE=0.3515, CV=0.2675, selecting variables between 200nm and 800nm. As shown in table 1. So the noises had great influence on the stepwise regression model.
But the prediction error of the stepwise regression model would increase after smoothing if selecting variables between 260nm and 380nm with smoothing span at 7. The reason may be that after smoothing some important information had been lost. When the smoothing span was set at 5, the prediction error reached minimum value.
Optimization of the stepwise regression model
The traditional stepwise regression does produce the minimum RMSE, but it is not calculated according to the formula (2), it is calculated according to formula (8) in the Matlab [16], SAS [17] stepwise regression program.
(8)
SSresid: sum of squared residuals
dfe: degree of freedom error
In formula (8), RMSE is related to the variable numbers selected into the stepwise regression model, not only the sum of squared residual errors. So the stepwise regression program did not terminate variable selection when the least prediction error was reached. The restrictive condition was introduced when selecting variables on the basis of p value. On the basis of p value, the traditional stepwise regression would select more variables into the model before optimized with SSE and get smaller fitting error except prediction error as shown in table 1.
In this study SSE was used to optimize the stepwise regression model. Besides, some other restrictive conditions can also be used for the optimization of variable selecting, for example RMSE, MAP, etc.
Error of derivation and validation group
According to some report [18], R2 in the validation group is larger than in the derivation group. In our study, the error between the determined concentration and the calculated concentration of Salviol B tell the same story. RMSE=0.5619, MAE=0.3467, CV=0.1921, in the two batches of samples which was used to establish the prediction model. In the testing samples, RMSE=0.3263, MAE=0.2323, CV=0.1796.
There were two reasons for this phenomenon. One is that the range of the concentration values of Salviol B is wider in the derivation group than in the validation group. The maximum value of batch 1 is 9.9156. The maximum value of batch 2 is 6.3097. The maximum value of batch 3 is 7.8561. The other reason is that the samples were focused on the lower values. So the fitting errors and the prediction errors were smaller at the lower values than at the higher values. If batch 2 and 3 were used as derivation group, RMSE=0.1678, MAE=0.1137, CV=0.0936 in the derivation group.
Conclusion
In this study the predicted concentration of Salviol B had bigger errors at the peak of the elution curve than elsewhere. However, what we care was when to start collecting the eluent liquid and when to stop collecting. At the start point and the cease point of collecting the error was smaller. So the UV spectral data could be used to monitor the purifying process of crude product of Salvianolate through macroporous resin chromatographic column by stepwise regression model.
Acknowlegement
Thanks for The Green Valley Company of Shanghai for providing the samples for this study and the HPLC content determination method of Salviol B.
References
- Zhang H, Zhang Y, Yang R, Li YJ, Wang M, et al. Correlation study on effects of salvianolate on inflammatory cytokines of patients with acute coronary syndrome. Chin J Integr Tradit West Med. 2013; 33: 598-601. Ref.: https://goo.gl/2X8V6P
- Jian J, Yingmin L, Nengcai YAO, Cunfang DOU, Cenchang Y, et al. Study of depside salt from salvia miltiorrhiza's effect on coronary slow flow phenomenon. J Clin Cardiol (China). 2011; 27: 751-752. Ref.: https://goo.gl/3QxH6B
- Yang HH, Qin F, Liang QL, Wang Y, Wang YM, et al. LapRLSR for NIR spectral modeling and its application to online monitoring of the column separation of Salvianolate. Chin Chem Lett. 2007; 18: 852-856. Ref.: https://goo.gl/he5qub
- Jin HY, Chen LG, Zhou XQ, Zhang SQ, Liu QW. On-line Monitoring of Dynamic Microwave-assisted Extraction of Scutellarin from Scutellaria barbata by UV Spectroscopy. J Jilin Univ (Sci. Edit.). 2009; 47: 1313-1317. Ref.: https://goo.gl/23bCcQ
- Sun NZ, Yang SL, Yeh WWG. A proposed stepwise regression method for model structure identification. Water Resour Res. 1998; 34: 2561-2572. Ref.: https://goo.gl/JWSJtj
- Liao XT, Li Q, Yang XJ, Zhang WG, Li W. Multiobjective optimization for crash safety design of vehicles using stepwise regression model. Struct. Multidisc. Optim. 2008; 35: 561–569. Ref.: https://goo.gl/XzpTqX
- Lachniet MS, Patterson WP. Use of correlation and stepwise regression to evaluate physical controls on the stable isotope values of Panamanian rain and surface waters. J Hydrol. 206; 324: 115–140. Ref.: https://goo.gl/bFQLu3
- Oros G, CserhAti T, Forgks E. Use of spectral mapping and stepwise regression analysis for the assessment of the relationship between chemical structure and biological activity of surfactants. Chemom Intell Lab Syst. 1997; 39: 95-101. Ref.: https://goo.gl/kS5P6Q
- Zhou N, Pierre JW, Trudnowski D. A stepwise regression method for estimating dominant electromechanical modes. IEEE Trans. Power Syst. 2012; 27: 1051-1059. Ref.: https://goo.gl/Hczrs7
- Jang CS, Youn BD, Wang PF, Han B, Ham SJ. Forward-stepwise regression analysis for fine leak batch testing of wafer-level hermetic MEMS packages. Microelectron Reliab. 2010; 50: 507-513. Ref.: https://goo.gl/rm6oDF
- Telmo C, Lousada J, Moreira N. Proximate analysis, backwards stepwise regression between gross calorific value, ultimate and chemical analysis of wood. Bioresour Technol. 2010; 101: 3808-3815. Ref.: https://goo.gl/8SwLVV
- Templ M, Kowarik A, Filzmoser P. Iterative stepwise regression imputation using standard and robust methods. Comput. Stat. Data Anal. 2011; 55: 2791-2806. Ref.: https://goo.gl/w5ZgQN
- Willmott CJ, Matsuura K. Advantages of the mean absolute error (MAE) over the root mean square error (RMSE) in assessing average model performance. Int J Clim Res. 2005; 30: 79-82. Ref.: https://goo.gl/7jBiMe
- Huang C, Townshend JRG. A stepwise regression tree for nonlinear approximation: applications to estimating subpixel land cover. Int J Remote Sensing. 2003; 24: 75–90. Ref.: https://goo.gl/8sfukP
- Ssegane H, Tollner EW, Mohamoud YM, Rasmussen TC, Dowd JF. Advances in variable selection methods Ⅰ:causal selection methods versus stepwise regression and principal component analysis on data of known and unknown functional relationship. J Hydrol. 2012; 438-439: 16-25. Ref.: https://goo.gl/53wLeh
- Ref.: https://goo.gl/Kf3cwW
- Ref.: https://goo.gl/42QkFw
- Malek MH, Berger DE, Coburn JW. On the inappropriateness of stepwise regression analysis for model building and testing. Eur J Appl Phsiol. 2007; 101: 263-264. Ref. https://goo.gl/PZBNp3

