Figure 2
Diazepam Withdrawal Expression is related to Hippocampal NOS-1 Upregulation
Emilce Artur de la Villarmois, María Florencia Constantin, Claudia Bregonzio and Mariela Fernanda Pérez*
Published: 08 January, 2018 | Volume 2 - Issue 1 | Pages: 001-009
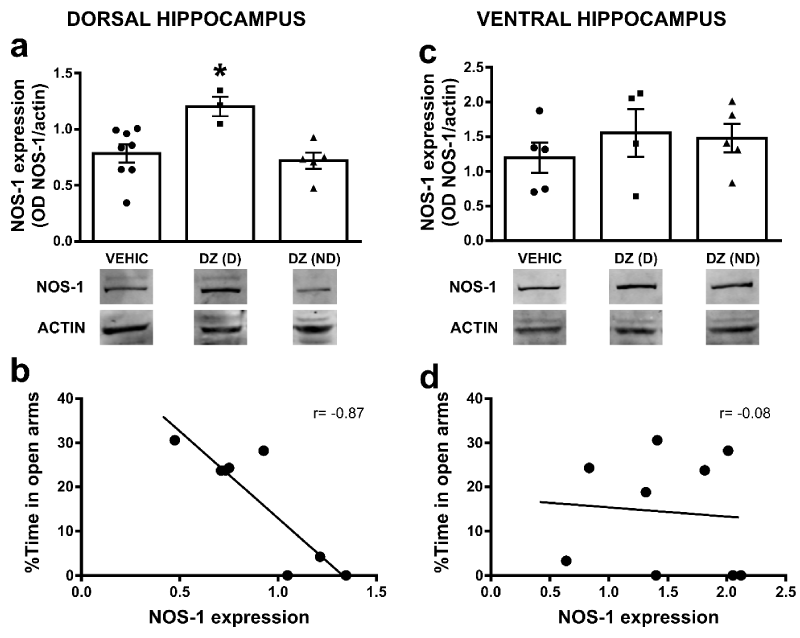
Figure 2:
Hippocampal NOS-1 expression in diazepam treated animals: a) Bar graphs show NOS-1 expression (OD, optical density, NOS-1/actin) in VEHIC, DZ(D) and DZ(ND) animals in dorsal HP (*p<0.05 compared to all groups). b) Graphs show correlation between the %TA and NOS-1 expression in DZ(D) and DZ(ND) in dorsal HP. The correlation coefficients (r) are indicated inside the graph. c) Bar graphs show NOS-1 expression (OD, optical density, NOS-1/actin) in VEHIC, DZ(D) and DZ(ND) animals in ventral HP. d) Graphs show correlation between the %TA and NOS-1 expression in DZ(D) and DZ(ND) in ventral HP. The correlation coefficients (r) are indicated inside the graph. In both a and c, bars represent means±SE and below each graph representative western blot for NOS-1 and actin immunoreactivity are shown. Full-length blots from cropped VEHIC, DZ(D) and DZ(ND) in dorsal and ventral HP are shown in supplementary figure 1a and 1b respectively.
Read Full Article HTML DOI: 10.29328/journal.hps.1001006 Cite this Article Read Full Article PDF
More Images
Similar Articles
-
Diazepam Withdrawal Expression is related to Hippocampal NOS-1 UpregulationEmilce Artur de la Villarmois,María Florencia Constantin,Claudia Bregonzio,Mariela Fernanda Pérez*. Diazepam Withdrawal Expression is related to Hippocampal NOS-1 Upregulation. . 2018 doi: 10.29328/journal.hps.1001006; 2: 001-009
-
Biologic therapy-Related demyelinating peripheral neuropathy in a child with Juvenile Idiopathic ArthritisHeba A Alqurashi,Ghada Al-Salmi,Mohammad A Al-Muhaizea,Sulaiman M Al-Mayouf*. Biologic therapy-Related demyelinating peripheral neuropathy in a child with Juvenile Idiopathic Arthritis. . 2018 doi: 10.29328/journal.apps.1001008; 2: 020-022
Recently Viewed
-
Assessment of Perceptions of Nursing Undergraduates towards Mental Health PracticesAlya Algamdii*. Assessment of Perceptions of Nursing Undergraduates towards Mental Health Practices. Clin J Nurs Care Pract. 2025: doi: 10.29328/journal.cjncp.1001059; 9: 007-011
-
Multipurpose Antioxidants based on Food Industry Waste: Production and Properties EvaluationToshkhodjaev*. Multipurpose Antioxidants based on Food Industry Waste: Production and Properties Evaluation. Arch Food Nutr Sci. 2025: doi: 10.29328/journal.afns.1001062; 9: 001-003
-
Relationship between Fertility Diet Score Index Items and Ovulation in Women with Polycystic Ovary Syndrome: A Narrative ReviewHadis Alimoradi,Faezeh Mashhadi,Ava Hemmat,Mohsen Nematy,Maryam Khosravi,Maryam Emadzadeh,Nayere Khadem Ghaebi,Fatemeh Roudi*. Relationship between Fertility Diet Score Index Items and Ovulation in Women with Polycystic Ovary Syndrome: A Narrative Review. Arch Food Nutr Sci. 2024: doi: 10.29328/journal.afns.1001061; 8: 041-048
-
Evaluation of the LumiraDx SARS-CoV-2 antigen assay for large-scale population testing in SenegalMoustapha Mbow*,Ibrahima Diallo,Mamadou Diouf,Marouba Cissé#,Moctar Gningue#,Aminata Mboup,Nafissatou Leye,Gora Lo,Yacine Amet Dia,Abdou Padane,Djibril Wade,Josephine Khady Badiane,Oumar Diop,Aminata Dia,Ambroise Ahouidi,Doudou George Massar Niang,Babacar Mbengue,Maguette Dème Sylla Niang,Papa Alassane Diaw,Tandakha Ndiaye Dieye,Badara Cisé,El Hadj Mamadou Mbaye,Alioune Dieye,Souleymane Mboup. Evaluation of the LumiraDx SARS-CoV-2 antigen assay for large-scale population testing in Senegal. Int J Clin Virol. 2022: doi: 10.29328/journal.ijcv.1001041; 6: 001-006
-
The Use and Prevalence of Cannabis among Students of Nnamdi Azikiwe University, Awka, Anambra StateChijioke M Ofomata*,Enyinna P Nnabuihe. The Use and Prevalence of Cannabis among Students of Nnamdi Azikiwe University, Awka, Anambra State. J Forensic Sci Res. 2025: doi: 10.29328/journal.jfsr.1001088; 9: 104-108
Most Viewed
-
Feasibility study of magnetic sensing for detecting single-neuron action potentialsDenis Tonini,Kai Wu,Renata Saha,Jian-Ping Wang*. Feasibility study of magnetic sensing for detecting single-neuron action potentials. Ann Biomed Sci Eng. 2022 doi: 10.29328/journal.abse.1001018; 6: 019-029
-
Evaluation of In vitro and Ex vivo Models for Studying the Effectiveness of Vaginal Drug Systems in Controlling Microbe Infections: A Systematic ReviewMohammad Hossein Karami*, Majid Abdouss*, Mandana Karami. Evaluation of In vitro and Ex vivo Models for Studying the Effectiveness of Vaginal Drug Systems in Controlling Microbe Infections: A Systematic Review. Clin J Obstet Gynecol. 2023 doi: 10.29328/journal.cjog.1001151; 6: 201-215
-
Prospective Coronavirus Liver Effects: Available KnowledgeAvishek Mandal*. Prospective Coronavirus Liver Effects: Available Knowledge. Ann Clin Gastroenterol Hepatol. 2023 doi: 10.29328/journal.acgh.1001039; 7: 001-010
-
Causal Link between Human Blood Metabolites and Asthma: An Investigation Using Mendelian RandomizationYong-Qing Zhu, Xiao-Yan Meng, Jing-Hua Yang*. Causal Link between Human Blood Metabolites and Asthma: An Investigation Using Mendelian Randomization. Arch Asthma Allergy Immunol. 2023 doi: 10.29328/journal.aaai.1001032; 7: 012-022
-
An algorithm to safely manage oral food challenge in an office-based setting for children with multiple food allergiesNathalie Cottel,Aïcha Dieme,Véronique Orcel,Yannick Chantran,Mélisande Bourgoin-Heck,Jocelyne Just. An algorithm to safely manage oral food challenge in an office-based setting for children with multiple food allergies. Arch Asthma Allergy Immunol. 2021 doi: 10.29328/journal.aaai.1001027; 5: 030-037

HSPI: We're glad you're here. Please click "create a new Query" if you are a new visitor to our website and need further information from us.
If you are already a member of our network and need to keep track of any developments regarding a question you have already submitted, click "take me to my Query."


