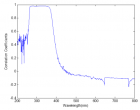
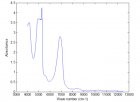
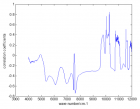
Figure 6
Stepwise regression modeling on the monitoring of separation of Salvianolate through macroporous resin chromatographic column using UV spectral data
Yongsuo Liu*, Yong Wang and Guoan Luo
Published: 17 February, 2019 | Volume 3 - Issue 1 | Pages: 001-010
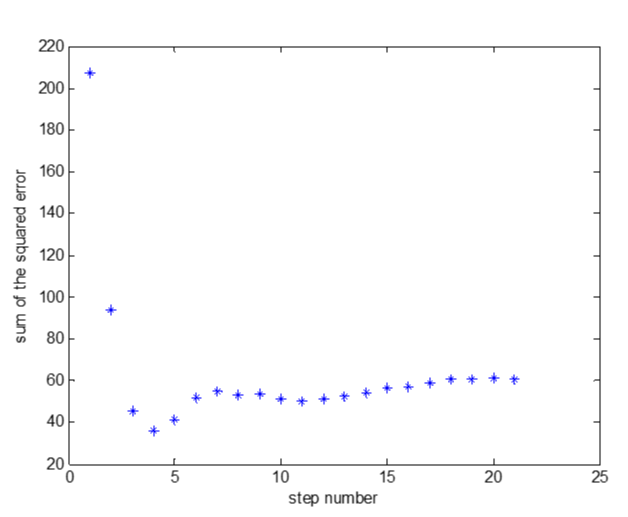
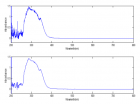
Figure 6:
The sum of the squared errors during the stepwise regression.
Read Full Article HTML DOI: 10.29328/journal.apps.1001012 Cite this Article Read Full Article PDF
More Images
Similar Articles
-
Stepwise regression modeling on the monitoring of separation of Salvianolate through macroporous resin chromatographic column using UV spectral dataYongsuo Liu*,Yong Wang,Guoan Luo. Stepwise regression modeling on the monitoring of separation of Salvianolate through macroporous resin chromatographic column using UV spectral data. . 2019 doi: 10.29328/journal.apps.1001012; 3: 001-010
-
Design and optimization of mRNAs encoding an Anti-TIGIT antibody with therapeutic potential for cancer in TIGIT-humanized BALB/c MiceJingmin Cui, Gulisaina Qiaerxie, Hui Qin, Feng Long, Xi Wang, Zhixin Yang, Peng Du*, Yong Cui*. Design and optimization of mRNAs encoding an Anti-TIGIT antibody with therapeutic potential for cancer in TIGIT-humanized BALB/c Mice. . 2023 doi: 10.29328/journal.apps.1001038; 7: 008-016
-
Beta-1 Receptor (β1) in the Heart Specific Indicate to StereoselectivityRezk Rezk Ayyad*, Ahmed Mohamed Mansour, Ahmed Mohamed Nejm, Yasser Abdel Allem Hassan, Norhan Hassan Gabr, Ahmed Rezk Ayyad. Beta-1 Receptor (β1) in the Heart Specific Indicate to Stereoselectivity. . 2024 doi: 10.29328/journal.apps.1001060; 8: 082-088
Recently Viewed
-
Sensitivity and Intertextile variance of amylase paper for saliva detectionAlexander Lotozynski*. Sensitivity and Intertextile variance of amylase paper for saliva detection. J Forensic Sci Res. 2020: doi: 10.29328/journal.jfsr.1001017; 4: 001-003
-
Extraction of DNA from face mask recovered from a kidnapping sceneBassey Nsor*,Inuwa HM. Extraction of DNA from face mask recovered from a kidnapping scene. J Forensic Sci Res. 2022: doi: 10.29328/journal.jfsr.1001029; 6: 001-005
-
The Ketogenic Diet: The Ke(y) - to Success? A Review of Weight Loss, Lipids, and Cardiovascular RiskAngela H Boal*, Christina Kanonidou. The Ketogenic Diet: The Ke(y) - to Success? A Review of Weight Loss, Lipids, and Cardiovascular Risk. J Cardiol Cardiovasc Med. 2024: doi: 10.29328/journal.jccm.1001178; 9: 052-057
-
Could apple cider vinegar be used for health improvement and weight loss?Alexander V Sirotkin*. Could apple cider vinegar be used for health improvement and weight loss?. New Insights Obes Gene Beyond. 2021: doi: 10.29328/journal.niogb.1001016; 5: 014-016
-
Maximizing the Potential of Ketogenic Dieting as a Potent, Safe, Easy-to-Apply and Cost-Effective Anti-Cancer TherapySimeon Ikechukwu Egba*,Daniel Chigbo. Maximizing the Potential of Ketogenic Dieting as a Potent, Safe, Easy-to-Apply and Cost-Effective Anti-Cancer Therapy. Arch Cancer Sci Ther. 2025: doi: 10.29328/journal.acst.1001047; 9: 001-005
Most Viewed
-
Evaluation of Biostimulants Based on Recovered Protein Hydrolysates from Animal By-products as Plant Growth EnhancersH Pérez-Aguilar*, M Lacruz-Asaro, F Arán-Ais. Evaluation of Biostimulants Based on Recovered Protein Hydrolysates from Animal By-products as Plant Growth Enhancers. J Plant Sci Phytopathol. 2023 doi: 10.29328/journal.jpsp.1001104; 7: 042-047
-
Sinonasal Myxoma Extending into the Orbit in a 4-Year Old: A Case PresentationJulian A Purrinos*, Ramzi Younis. Sinonasal Myxoma Extending into the Orbit in a 4-Year Old: A Case Presentation. Arch Case Rep. 2024 doi: 10.29328/journal.acr.1001099; 8: 075-077
-
Feasibility study of magnetic sensing for detecting single-neuron action potentialsDenis Tonini,Kai Wu,Renata Saha,Jian-Ping Wang*. Feasibility study of magnetic sensing for detecting single-neuron action potentials. Ann Biomed Sci Eng. 2022 doi: 10.29328/journal.abse.1001018; 6: 019-029
-
Pediatric Dysgerminoma: Unveiling a Rare Ovarian TumorFaten Limaiem*, Khalil Saffar, Ahmed Halouani. Pediatric Dysgerminoma: Unveiling a Rare Ovarian Tumor. Arch Case Rep. 2024 doi: 10.29328/journal.acr.1001087; 8: 010-013
-
Physical activity can change the physiological and psychological circumstances during COVID-19 pandemic: A narrative reviewKhashayar Maroufi*. Physical activity can change the physiological and psychological circumstances during COVID-19 pandemic: A narrative review. J Sports Med Ther. 2021 doi: 10.29328/journal.jsmt.1001051; 6: 001-007

HSPI: We're glad you're here. Please click "create a new Query" if you are a new visitor to our website and need further information from us.
If you are already a member of our network and need to keep track of any developments regarding a question you have already submitted, click "take me to my Query."


